Getting set up with Google Analytics for Understanding Site Traffic
Once you’ve received your email, your account is set up and access to Google Analytics will be available to the specified email address. If you already have a Gmail account, then the process above can be is as simple as clicking on “SIGN IN” in the upper right side of the screen, read the introduction screen, and click on the “Sign up” button.
After signing up for Google Analytics, you’ll need to put in some basic information about the site(s) that with traffic that you want to track including whether you want to track a website or mobile app. This process is relatively simple. We’ll track a website.
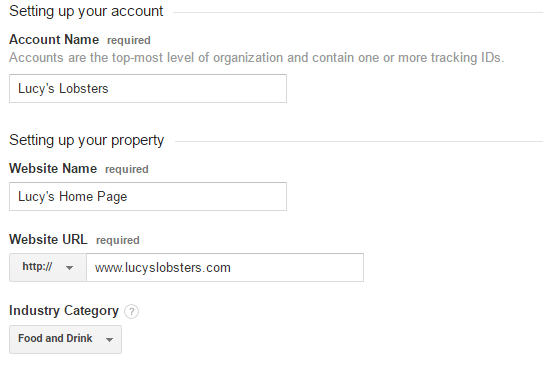
We enter an Account Name (like Lucy’s Lobsters) a website name (like Lucy’s Home Page), the URL (like http://www.lucyslobsters.com), and Industry (we’ll pick Food and Drink), and a Reporting Time Zone (we’ll use Eastern Time). Note that at the bottom of the page are the Data Sharing Settings, so select wisely to determine how much or how little email you want to receive.
Once the website URL has been submitted, you’ll be prompted to agree to Google Analytics Terms of Service.
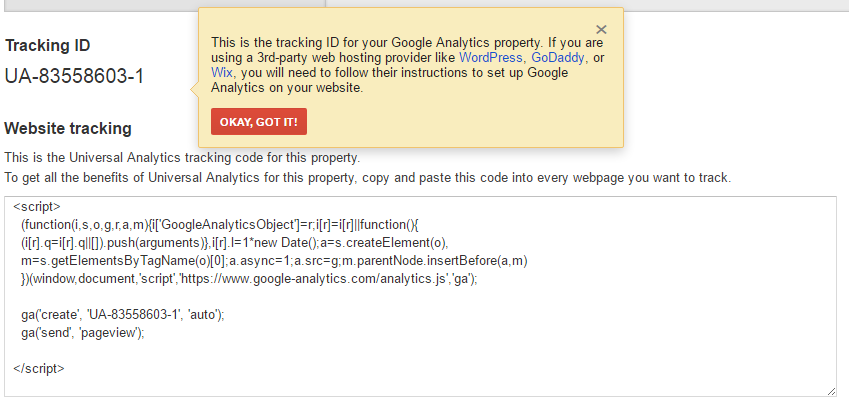
Then, Google Analytics provides you with a tracking ID and some code will be available. The generated code contains the tracking number and must be placed in the header of your site. The tracking code allows the data to know which account is associated with the data collected. The Google Analytics account allows data from 50 different sites to be saved and collected.
Account access can also be extended to other members of a team once they have gone through the process of creating a Google Analytics account. The added users can be extended different levels of permissions to allow them to add new sites or manipulate the generated data.
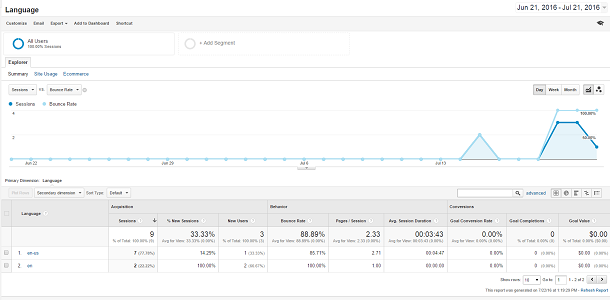
The data about the site is automatically put into graphs and tables; the different metrics can be compared against each other.
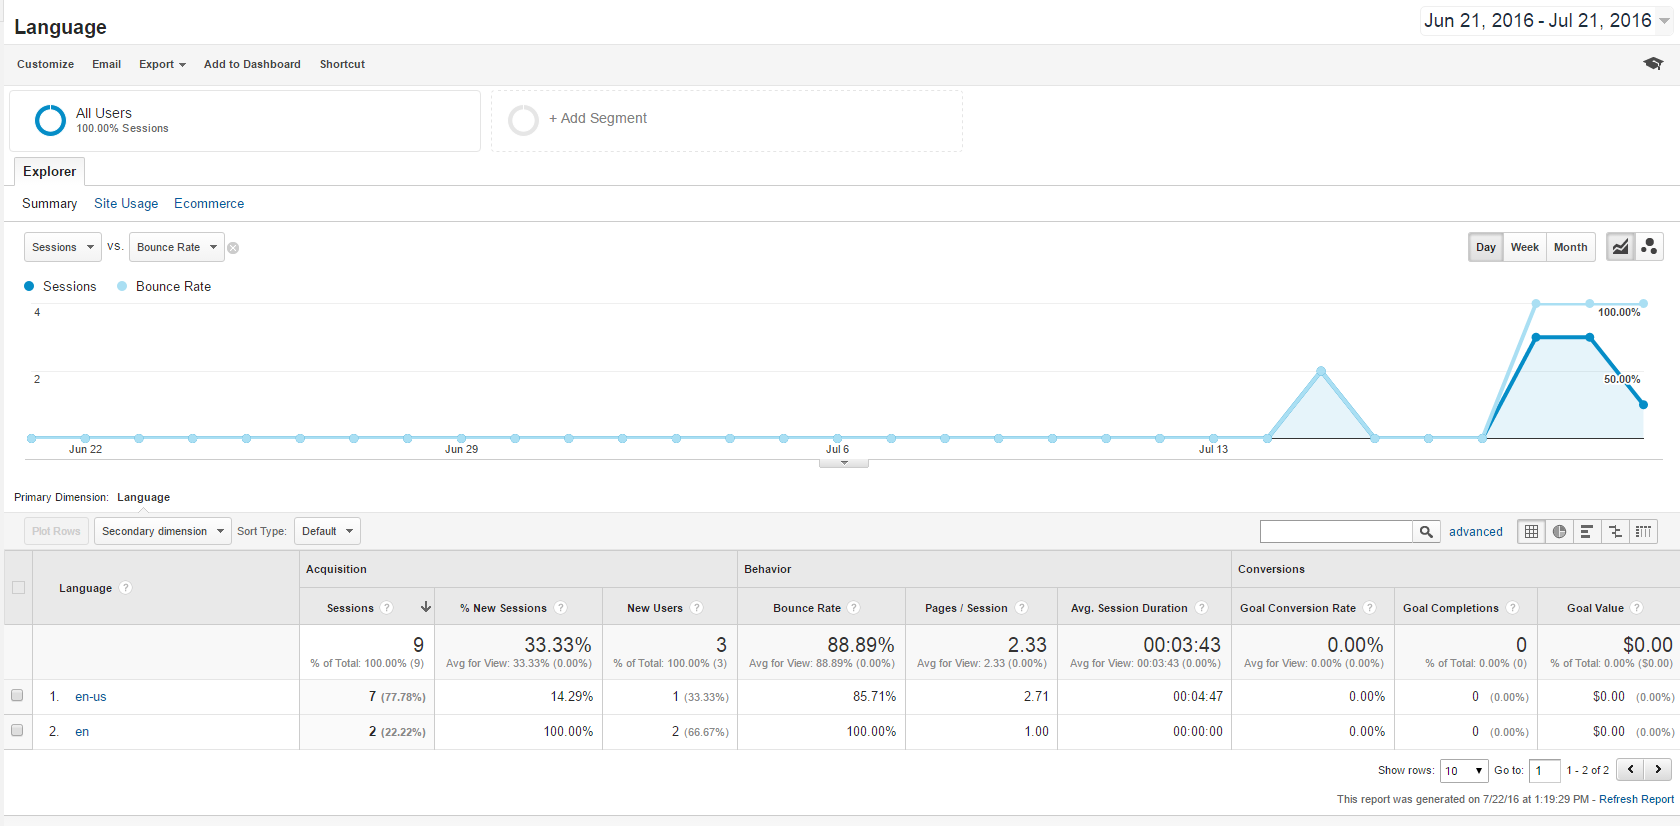
For example, sessions can be compared against the bounce rates or any other value that was recorded and a secondary graph will also be generated to show the compared metrics. The ease of use paired with the functionality of Google Analytics makes it a must for anyone that wants to gain insight into the traffic that their sites generate.
Share this Post:Posted by Tyrone Pascal