An Introduction to Google Analytics User Flows

One of our goals in using Google Analytics is to understand the actions of our audience. By understanding our audience and the information that they find useful on our website, we can work to improve the quality of information we provide, improve the descriptions of our services and products, and as a result, attract more first-time and repeat visitors to the site.
One great method for understanding our website audience is to use the traffic source menu in Google Analytics. Traffic source allows you to see how many people and devices have visited your site. This could be from a direct search where the user entered the site’s address or an organic search where the user finds the site after typing a search phrase in their browser. Users can be viewed on an hourly, daily, weekly or monthly basis. The snapshot of a Google Analytics chart below shows a new site and details about the people using the site. The metrics of the initial graph can provide further information by selecting an additional metric to compare or changing the primary metric.
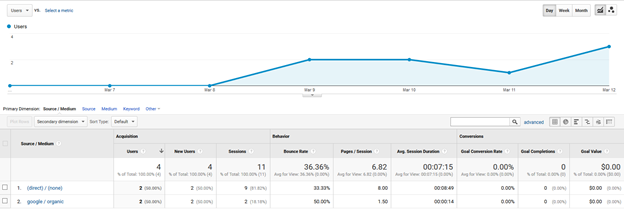
Figure 1. Shows users, session durations, bounce rates, and other information.
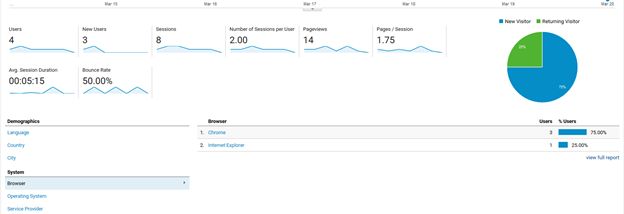
Figure 2. Shows demographic and system data that can be selected to get more insight on the site’s visitors.
Having users find your site deliberately would be the ideal outcome but based on the service or resource your site provides, having users find your site through Search Engine Optimization (SEO) and investments in Google keywords can be used to reach a wider range of potential users that might not have known about your site otherwise.
As a company website, we want users to move past the home page of our website; we want them to find other compelling content on our website. We want users to navigate to different pages to find out more about our products and services. In short, we want them to navigate to the “Contact Us” page and take the action to reach out to us.
The Google Analytics’ Users Flow features help us understand how users are navigating our website. The flow shows all pages the user traverses up until the point that they leave the site. The flow chart will even show real-time data of users that are still on the site. The primary variable can be changed to group users based on location, device type, language, browser and many more options. At a glance, this data can indicate how different user groups move through the site. Do mobile users drop off quicker? Do Chrome users spend more time on the site? Do users in English speaking countries visit the “Contact Us” page more often than others? All of these question can easily be answered by changing the variable that groups the users on our website.
There are many more functions that Google Analytics provides that will help you or your team understand and make inferences about the users of your site, it’s just a matter of finding the right functions and knowing how to use them.
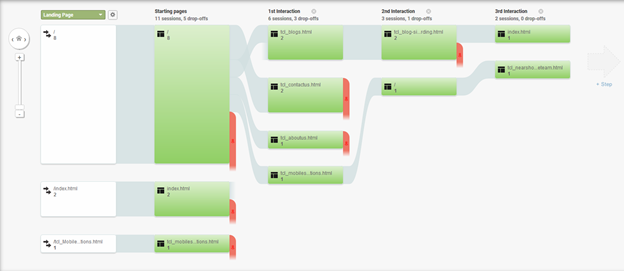
A quick glance at Figure 3, might raise questions about why visitors aren’t going to other pages on the site that describe other services. By taking 15 minutes a week to review this data, you can quickly understand what content is attracting users, and particularly, what content is driving users to reach out to you for more information about your products and services. When you find that users aren't visiting a particular page, first consider making small changes to the title text that describes what is on that page. It may be that the text in your menus simply doesn’t resonate with your target audience. Make changes a little at a time and then review the flow diagram a week or two later to determine if the changes have directed more traffic to where you want users to go.
Share this Post:Posted by Tyrone Pascal