VBA For Form Editing
Formatting data in a usable and concise form can sometimes be an issue in our line of work. During our last project, we were tasked with redesigning an application form into a cloud-based, web-accessible form. At the end of this cycle, we were faced with another formatting problem – the cloud-based application printed across twice as many pages as the original application form, so we needed a solution that would result in nicely formatted printed reports.
Our goal was now to revert the changes we had done to the application form to the previous application form layout that was more tree-friendly when printing. At first, this could be seen as a simple process in which we could simply revert the changes we made to the form.
However the process was a lot more difficult. There were many new fields that were added to the application form when we ported it to the cloud, and manually changing the layout of 700 to 800 applications would not be practical with the time sensitive nature of this project.
Our first attempt to solve this problem was to work with a word document and create a script that would import the data from excel. This method was not ideal because it would still require us to manually format at least one template and apply those changes to all 700 plus applications.
By working from excel, we were able to make all of the necessary format changes in the VBA scripts and apply those changes to all the data that would be imported into the Word document. We created our VBA code in Excel and Notepad++. Figure 1. shows the variable declarations of the VBA script that was created. The code starts by
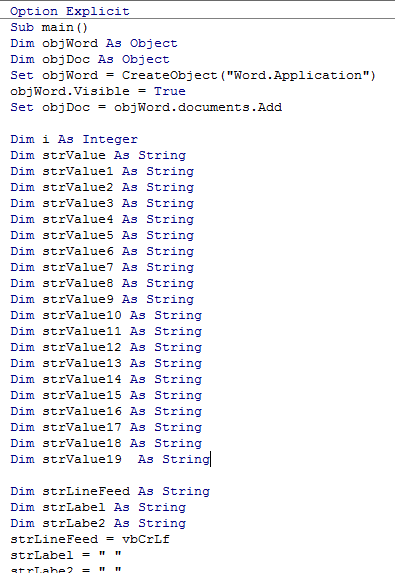
Figure 2. shows labels and mapping each cell from the excel sheet to a variable that would populate the word document. Labels could have been used directly from Excel but we also worked to define a format that would allow us to create labels within the code. The concatenation of the labels with the values from the spreadsheet define what is output to the Word document.
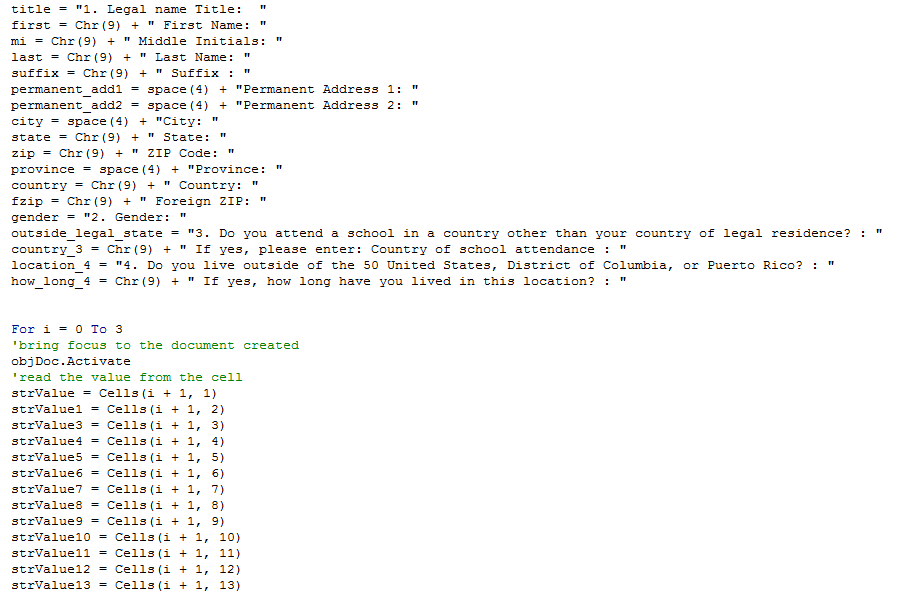
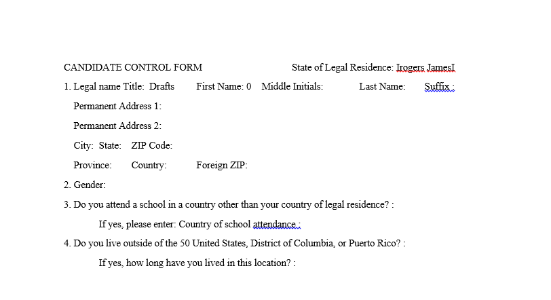
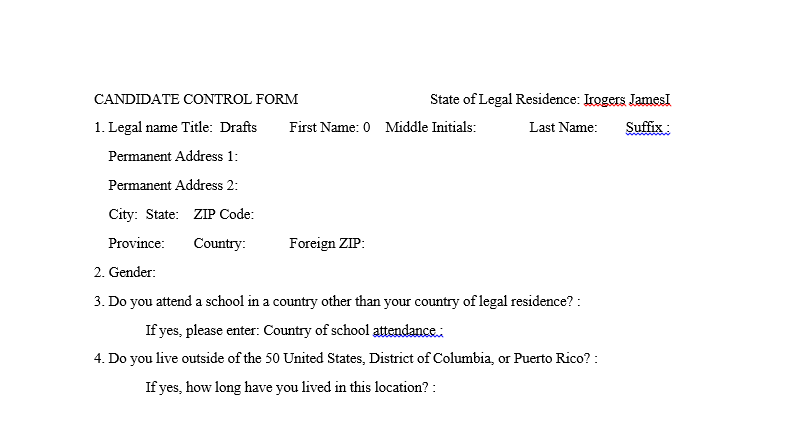
Figure 3. shows the first applicant that was output to a sample Word document created by running the script. We used a predefined loop from 0 to 3 for each applicant that was present in the report. Ideally we would implement a dynamic loop that would not require us to define the length of the loop, which would allow us to use this same script for other reports with the same fields/labels but may have varying amounts of applicants in each one.
Posted by Tyrone Pascal

Related Posts:


Donec sed odio dui. Nulla vitae elit libero, a pharetra augue. Nullam id dolor id nibh ultricies vehicula ut id elit. Integer posuere erat a ante venenatis dapibus posuere velit aliquet.
Nullam id dolor id nibh ultricies vehicula ut id elit.
Integer posuere erat a ante venenatis dapibus posuere velit aliquet.